.avif)

📌 Key Takeaways
Transform Raw Data into Strategic Intelligence: Your resident engagement platform generates thousands of monthly data points, but the real value lies in transforming this information into actionable intelligence that could potentially impact your community's financial performance and resident satisfaction.
Seven Critical Metrics That May Influence NOI: Focus on amenity utilization rates, event attendance patterns, service request resolution times, digital engagement frequency, peer-to-peer interactions, ancillary service adoption, and survey response rates—these metrics work synergistically to create a comprehensive picture of community health beyond traditional occupancy rates.
Early Warning System for Retention Risks: Declining app usage, reduced event participation, and decreased social engagement may serve as leading indicators of resident dissatisfaction weeks or months before traditional metrics reflect problems, though individual circumstances and external factors also play significant roles.
Revenue Optimization Through Behavioral Analysis: Connect amenity usage patterns to potential rental premiums and retention value by calculating direct revenue correlations, analyzing cost savings from reduced turnover, and identifying ancillary revenue opportunities that engaged residents often generate.
Proactive Intervention Strategies: Create engagement threshold alerts across multiple categories to implement targeted outreach, personalized service offerings, or direct communication when residents fall below established baselines, potentially addressing concerns before they impact renewal decisions.
Understanding these analytical frameworks positions property managers for success in an increasingly competitive market where data-driven decisions separate leaders from followers, though proper analysis and context remain essential for accurate interpretation.
Your resident engagement platform generates thousands of data points monthly—amenity bookings, event attendance, service requests, survey responses. But raw numbers alone don't drive strategic decisions or justify capital expenditures. The real value lies in transforming this data into actionable intelligence that could potentially impact on your community's financial performance and resident satisfaction.
Modern Class A multifamily properties operate in an increasingly competitive landscape where data-driven decisions separate market leaders from followers. Your platform's analytics capabilities extend far beyond traditional property management metrics, offering visibility into resident behavior patterns, preference trends, and satisfaction drivers that may correlate with retention rates and revenue optimization opportunities.
Business Impact: Strategic data analysis from resident engagement platforms may help reveal opportunities for improved amenity utilization rates and could potentially help identify retention risk factors earlier than traditional indicators, enabling more proactive intervention strategies when properly implemented and analyzed.
Metrics That Matter: Identifying KPIs for Resident Satisfaction and NOI
Not all engagement metrics carry equal weight in strategic decision-making. The most valuable data points are those that demonstrate potential connections between resident behavior and financial outcomes. Focus on metrics that serve dual purpose: improving resident experience while providing insights into measurable business results.
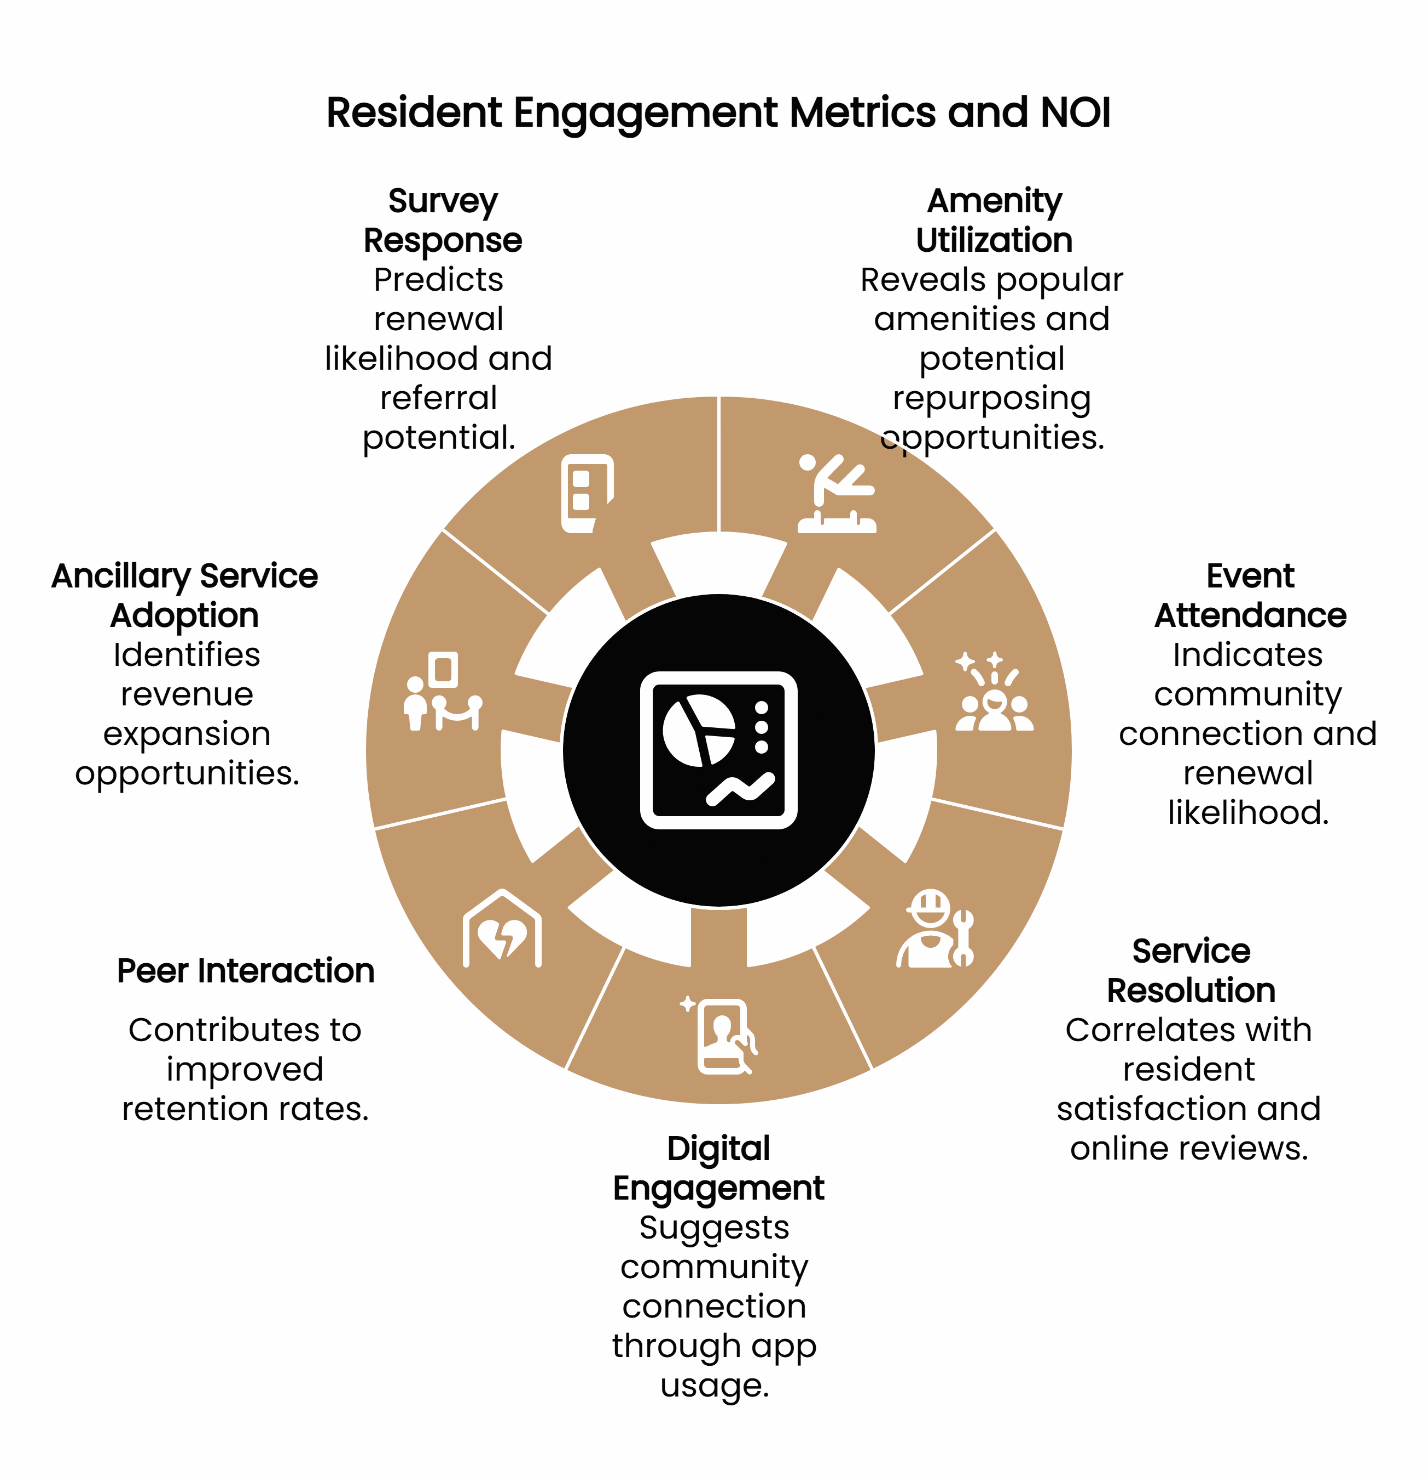
The 7 Key Resident Engagement Metrics That May Influence NOI
1. Amenity Utilization Rate by Category Track usage patterns across fitness centers, social spaces, business centers, and outdoor areas. This data reveals which amenities justify their operational costs and which spaces might benefit from repurposing or enhanced programming.
2. Event Attendance and Repeat Participation Monitor both initial attendance and return rates for community events. High repeat participation often indicates strong community connection and may suggest higher lease renewal likelihood.
3. Service Request Resolution Time and Satisfaction Scores Measure both operational efficiency and resident satisfaction with maintenance responses. This metric frequently correlates with online review ratings and can influence renewal decisions.
4. Digital Engagement Frequency Track how often residents interact with your community app, including feature usage patterns and session duration. Higher engagement typically suggests stronger community connection, though individual circumstances vary.
5. Peer-to-Peer Interaction Metrics Monitor resident-to-resident connections through community forums, interest groups, and social features. Strong peer networks often contribute to improved retention rates.
6. Ancillary Service Adoption Rates Track uptake of premium services like housekeeping, pet care, or concierge services. These metrics indicate resident satisfaction with lifestyle offerings and may identify revenue expansion opportunities.
7. Survey Response Rates and Net Promoter Scores Measure both participation rates and sentiment trends. Response rates indicate community engagement levels, while NPS scores may predict renewal likelihood and referral potential.
These metrics work synergistically. High amenity utilization combined with strong peer interactions and positive service experiences creates a comprehensive picture of community health that traditional occupancy rates alone cannot provide.
From Bookings to Budgets: How Amenity Data Drives Revenue Decisions
Amenity usage data transforms from simple activity tracking into valuable financial intelligence when analyzed through a revenue lens. The key lies in connecting resident behavior patterns to potential business outcomes and budget justifications.
Day-to-Day Application Example: Property management teams can use weekly amenity reports to identify underutilized spaces during specific time periods, then implement targeted programming or flexible pricing strategies to potentially maximize usage and revenue.
Calculating the Potential ROI of Your Community's Favorite Perks
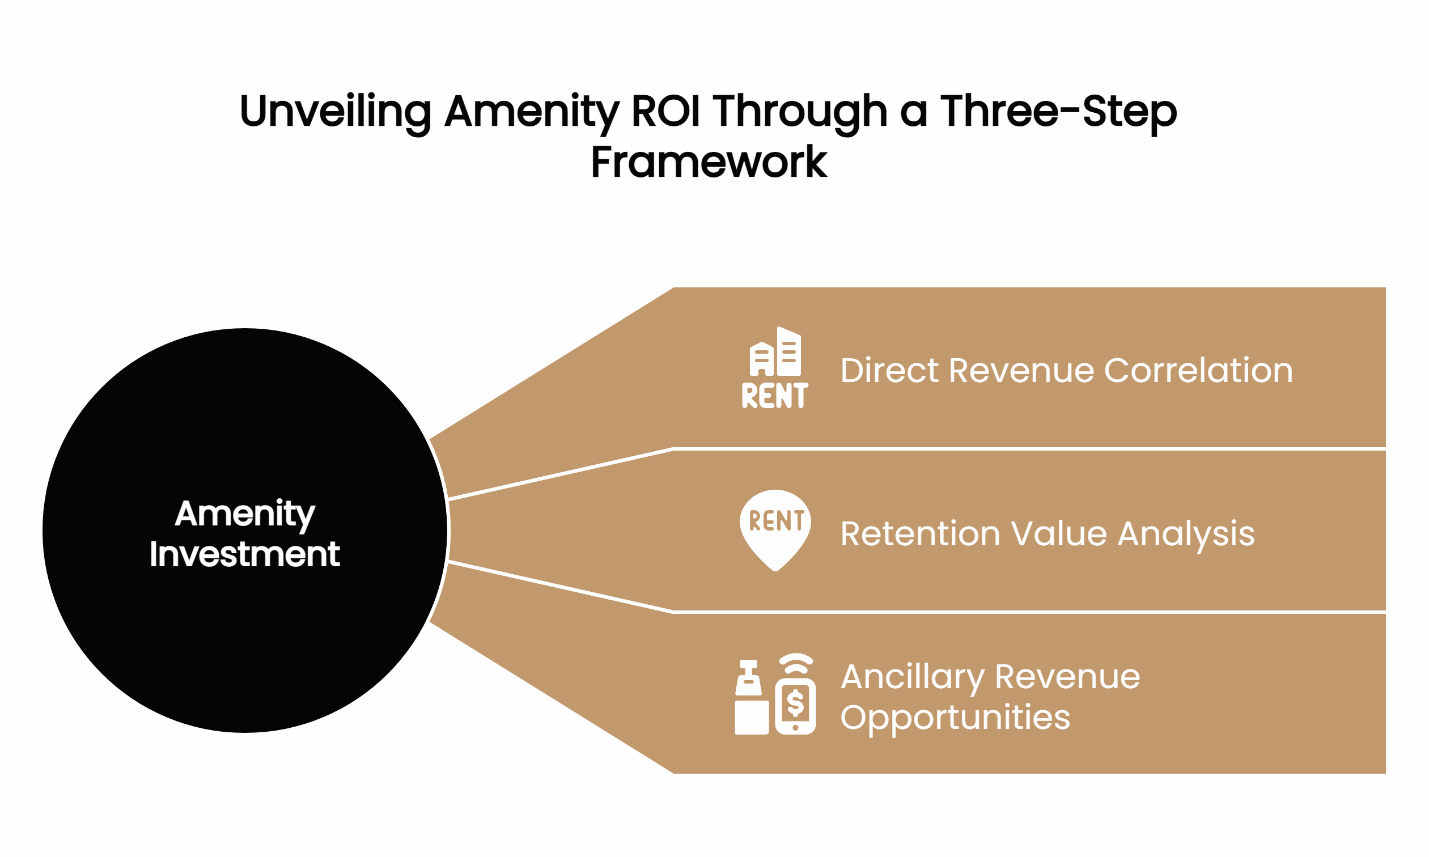
The most effective approach involves a three-step framework that connects amenity investment to measurable returns:
Step 1: Direct Revenue Correlation Calculate the relationship between amenity usage and rental premiums. Class A properties with high-performing fitness centers may command higher rents than comparable properties without these amenities, though this varies significantly by market, location, and other property features. Track which residents use premium amenities most frequently and compare their lease renewal rates to non-users.
Step 2: Retention Value Analysis Determine the potential cost savings associated with reduced turnover. When residents actively engage with community amenities, they often renew leases at higher rates than less engaged residents, though individual circumstances and external factors also play significant roles. Calculate the dollar value of this retention improvement by considering marketing costs, vacancy periods, and turnover preparation expenses.
Step 3: Ancillary Revenue Opportunities Identify how amenity usage might drive additional revenue streams. Residents who regularly use fitness facilities often show higher adoption rates for wellness services, while those who frequent social spaces tend to book private event rooms more frequently.
The most successful Class A communities treat amenity data as a potential predictor of future revenue rather than just a measure of current usage. This forward-looking approach enables proactive budget allocation and strategic planning.
Technical Note: Modern resident engagement platforms often offer integration capabilities with financial management systems, allowing for correlation analysis between usage patterns and revenue metrics. This integration can reduce manual data processing time while improving accuracy.
The Proactive Approach: Using Engagement Patterns to Predict Resident Retention
Leading indicators of resident satisfaction—or dissatisfaction—may appear in engagement data weeks or months before traditional metrics reflect problems. Sophisticated analysis of these patterns could enable proactive intervention strategies that help prevent costly turnover.
Declining app usage frequency might serve as an early warning system. When residents significantly reduce their digital engagement over extended periods, this could potentially precede lease non-renewal decisions, though personal circumstances, work changes, or technology preferences may also explain this behavior.
Service request patterns also reveal potential retention risks. Residents who submit multiple requests in short timeframes, particularly for recurring issues, often develop negative perceptions of property management responsiveness. More concerning, residents who stop submitting service requests entirely may have mentally "checked out" of the community, though they might also have found alternative solutions or simply prefer different communication methods.
Social engagement metrics provide additional potentially predictive value. Residents who disengage from community forums, stop participating in interest groups, or reduce peer-to-peer interactions might do so because they've begun considering alternative living arrangements—though job changes, family situations, or evolving social preferences could also explain these patterns.
The most actionable approach involves creating engagement threshold alerts. When residents fall below established engagement baselines across multiple categories, property management teams can implement targeted outreach strategies, personalized service offerings, or direct communication to address potential underlying concerns before they impact renewal decisions.
"The most valuable resident data isn't what tells you about yesterday's problems, it's what helps you prevent tomorrow's departures."
Conclusion: Making Data-Driven Decisions a Core Part of Your Community's DNA
Transforming resident engagement data into strategic intelligence requires moving beyond surface-level metrics to uncover the deeper patterns that may drive business outcomes. The most successful Class A multifamily properties treat their resident engagement platform as a comprehensive business intelligence system rather than simply an operational tool.
This analytical approach becomes even more critical as the industry evolves toward portfolio-level management strategies. The frameworks and metrics established at the individual property level serve as the foundation for broader strategic analysis across multiple assets. Understanding how to extract actionable insights from resident engagement data positions property managers for success in regional or portfolio-level roles, where the ability to identify patterns across properties and markets becomes a competitive advantage.
The integration of resident engagement analytics with traditional property management metrics creates a comprehensive view of community performance that enables more confident decision-making in an increasingly complex market environment. Properties that master this integration don't just retain residents—they create communities where people choose to stay, recommend to others, and contribute to long-term asset value appreciation.
Ready to unlock the potential of your resident engagement data? Schedule a Demo to see how ElevateOS transforms raw analytics into strategic insights that may drive measurable business results.